O.C.Tanner · Strategy · Productized I.P.
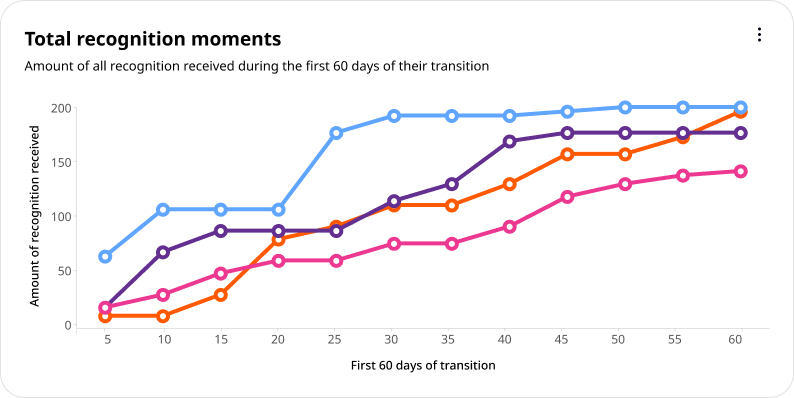
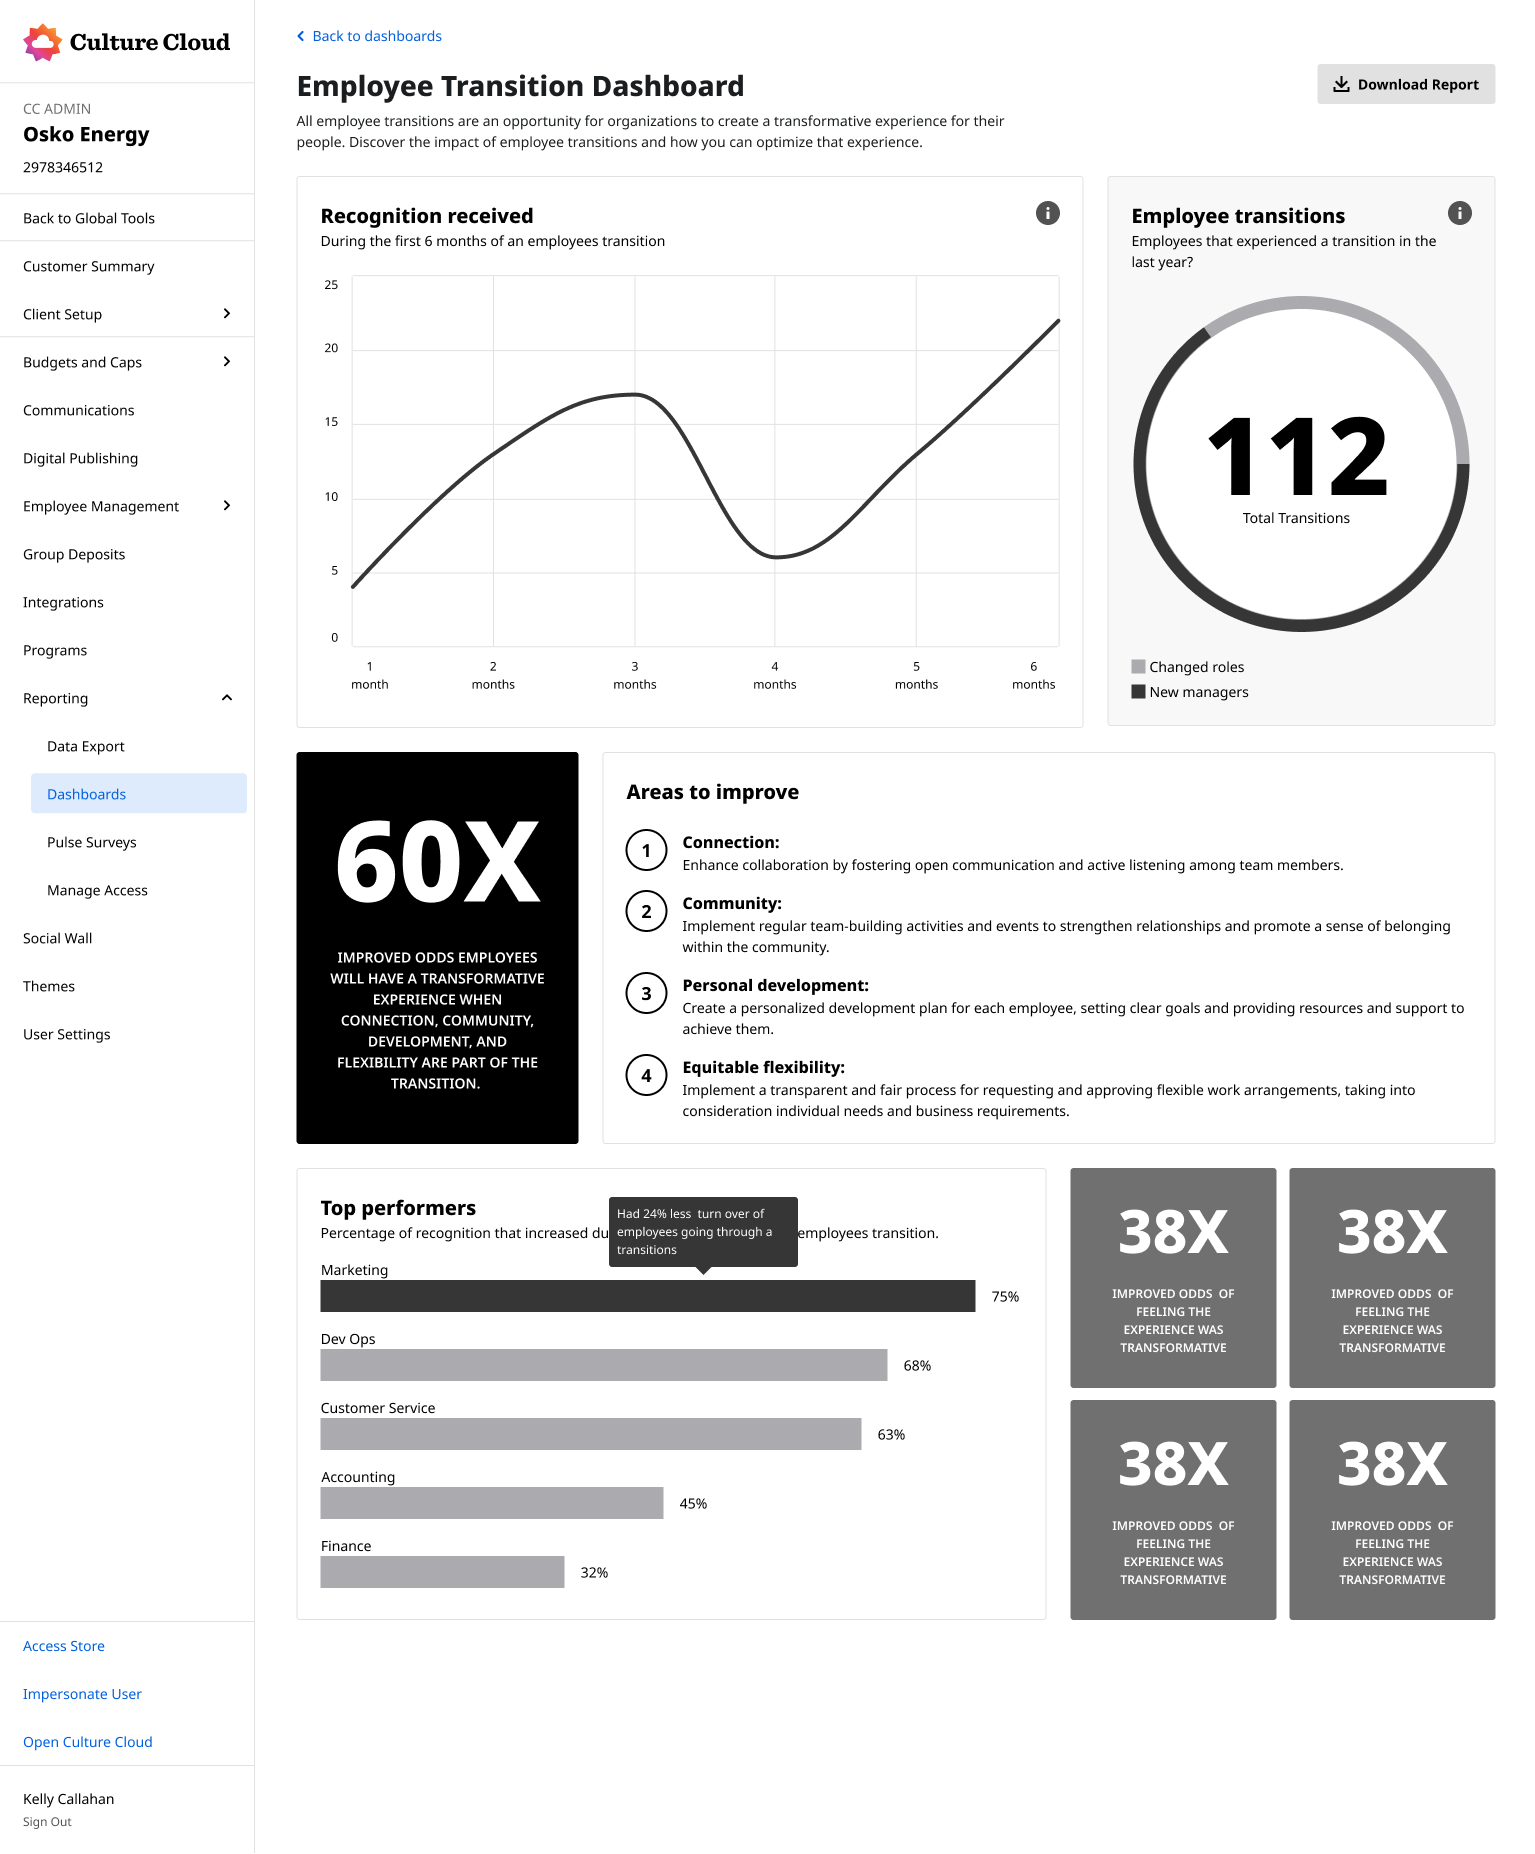
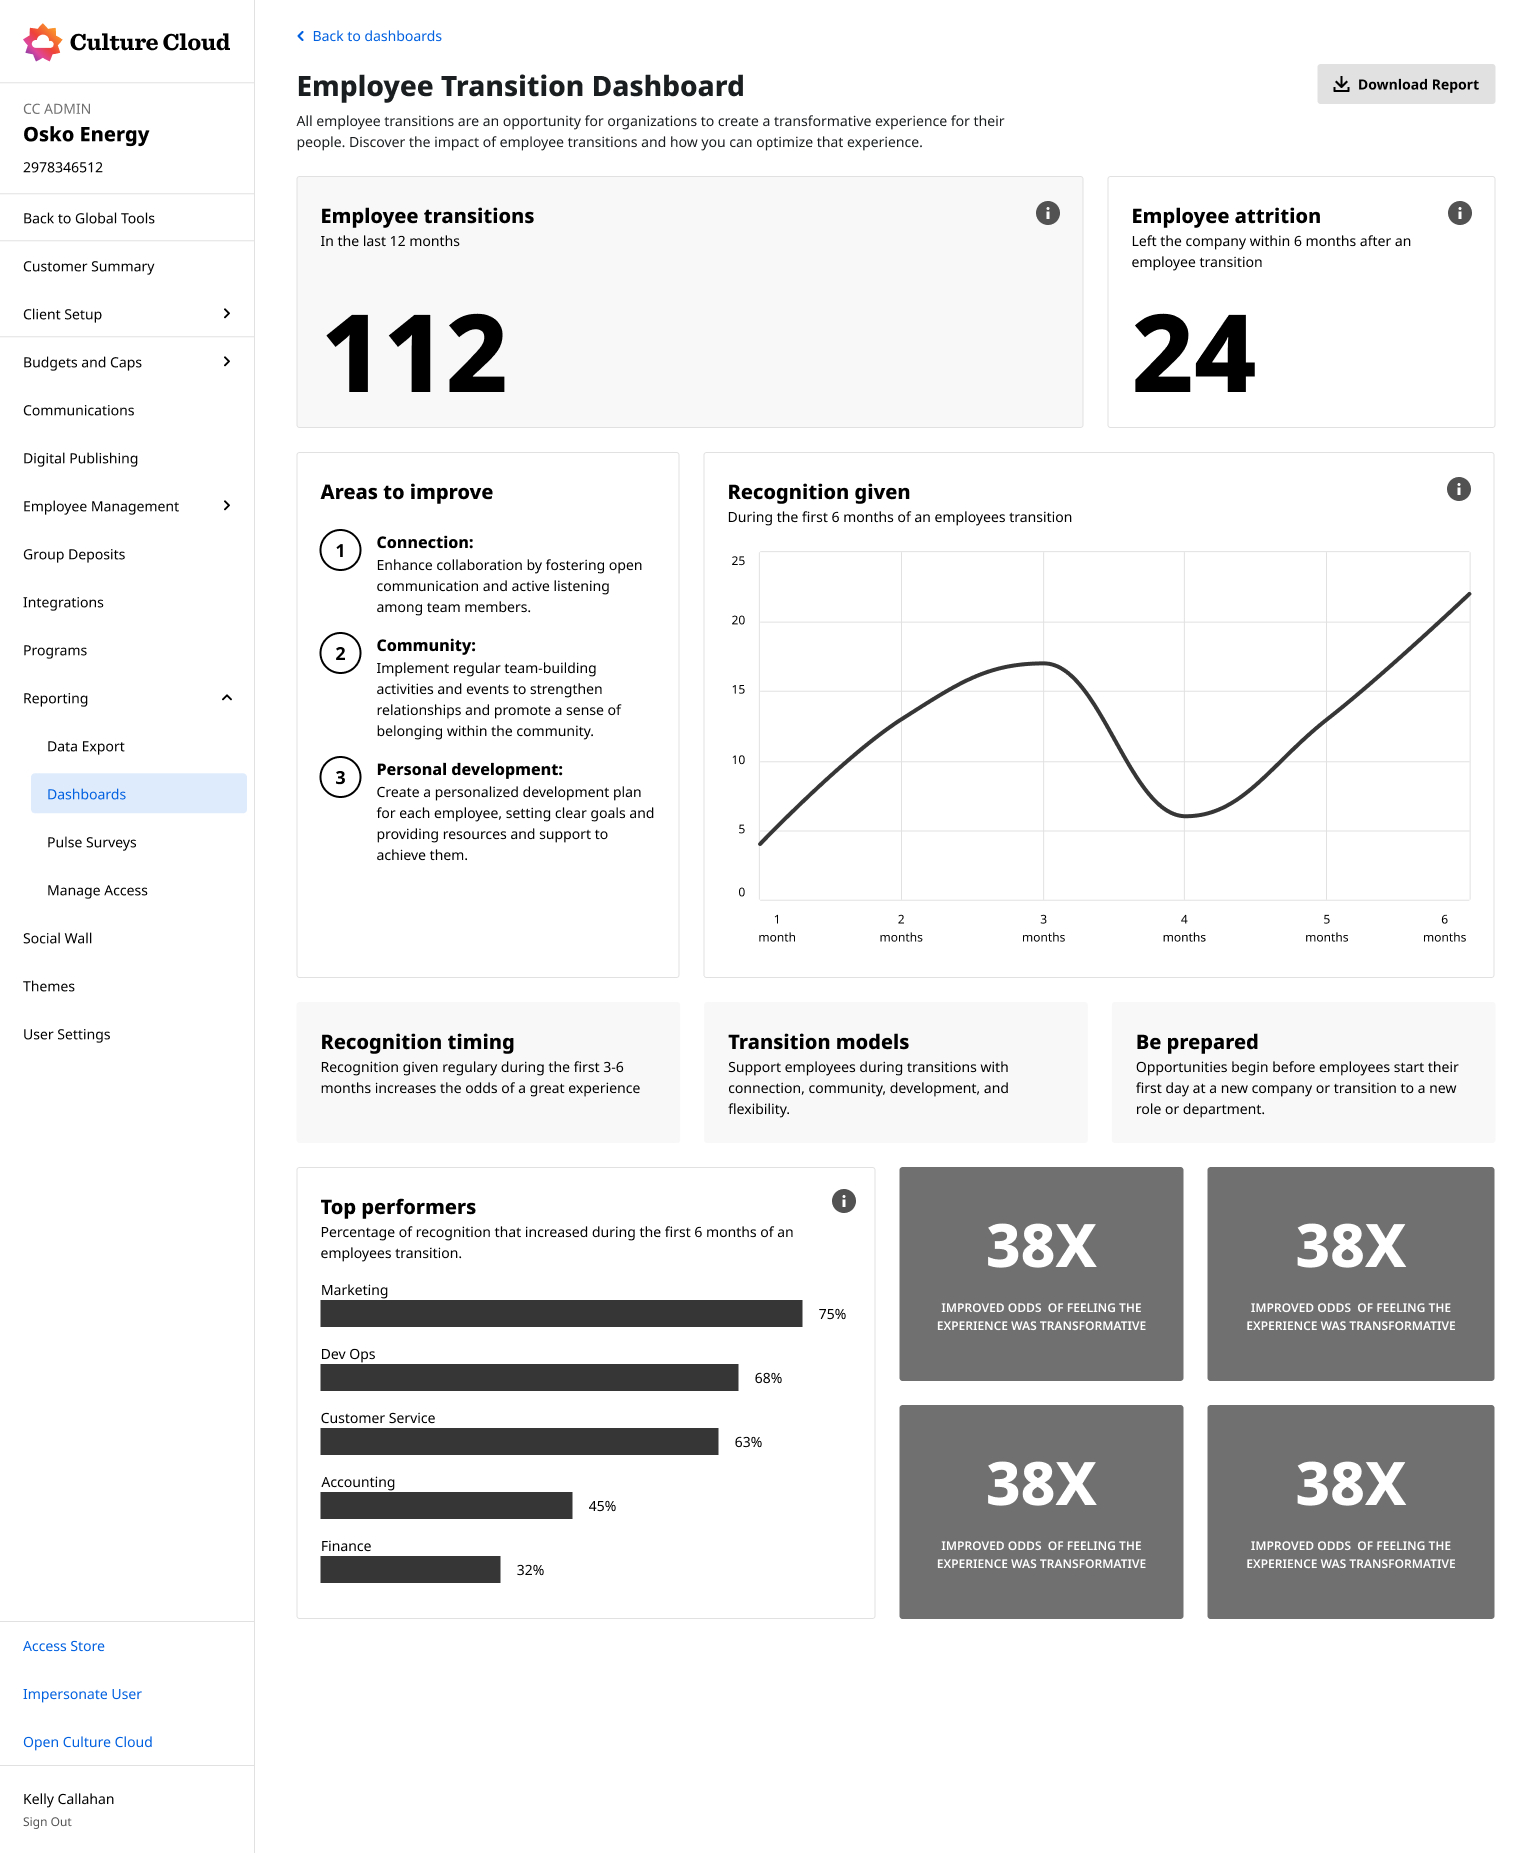
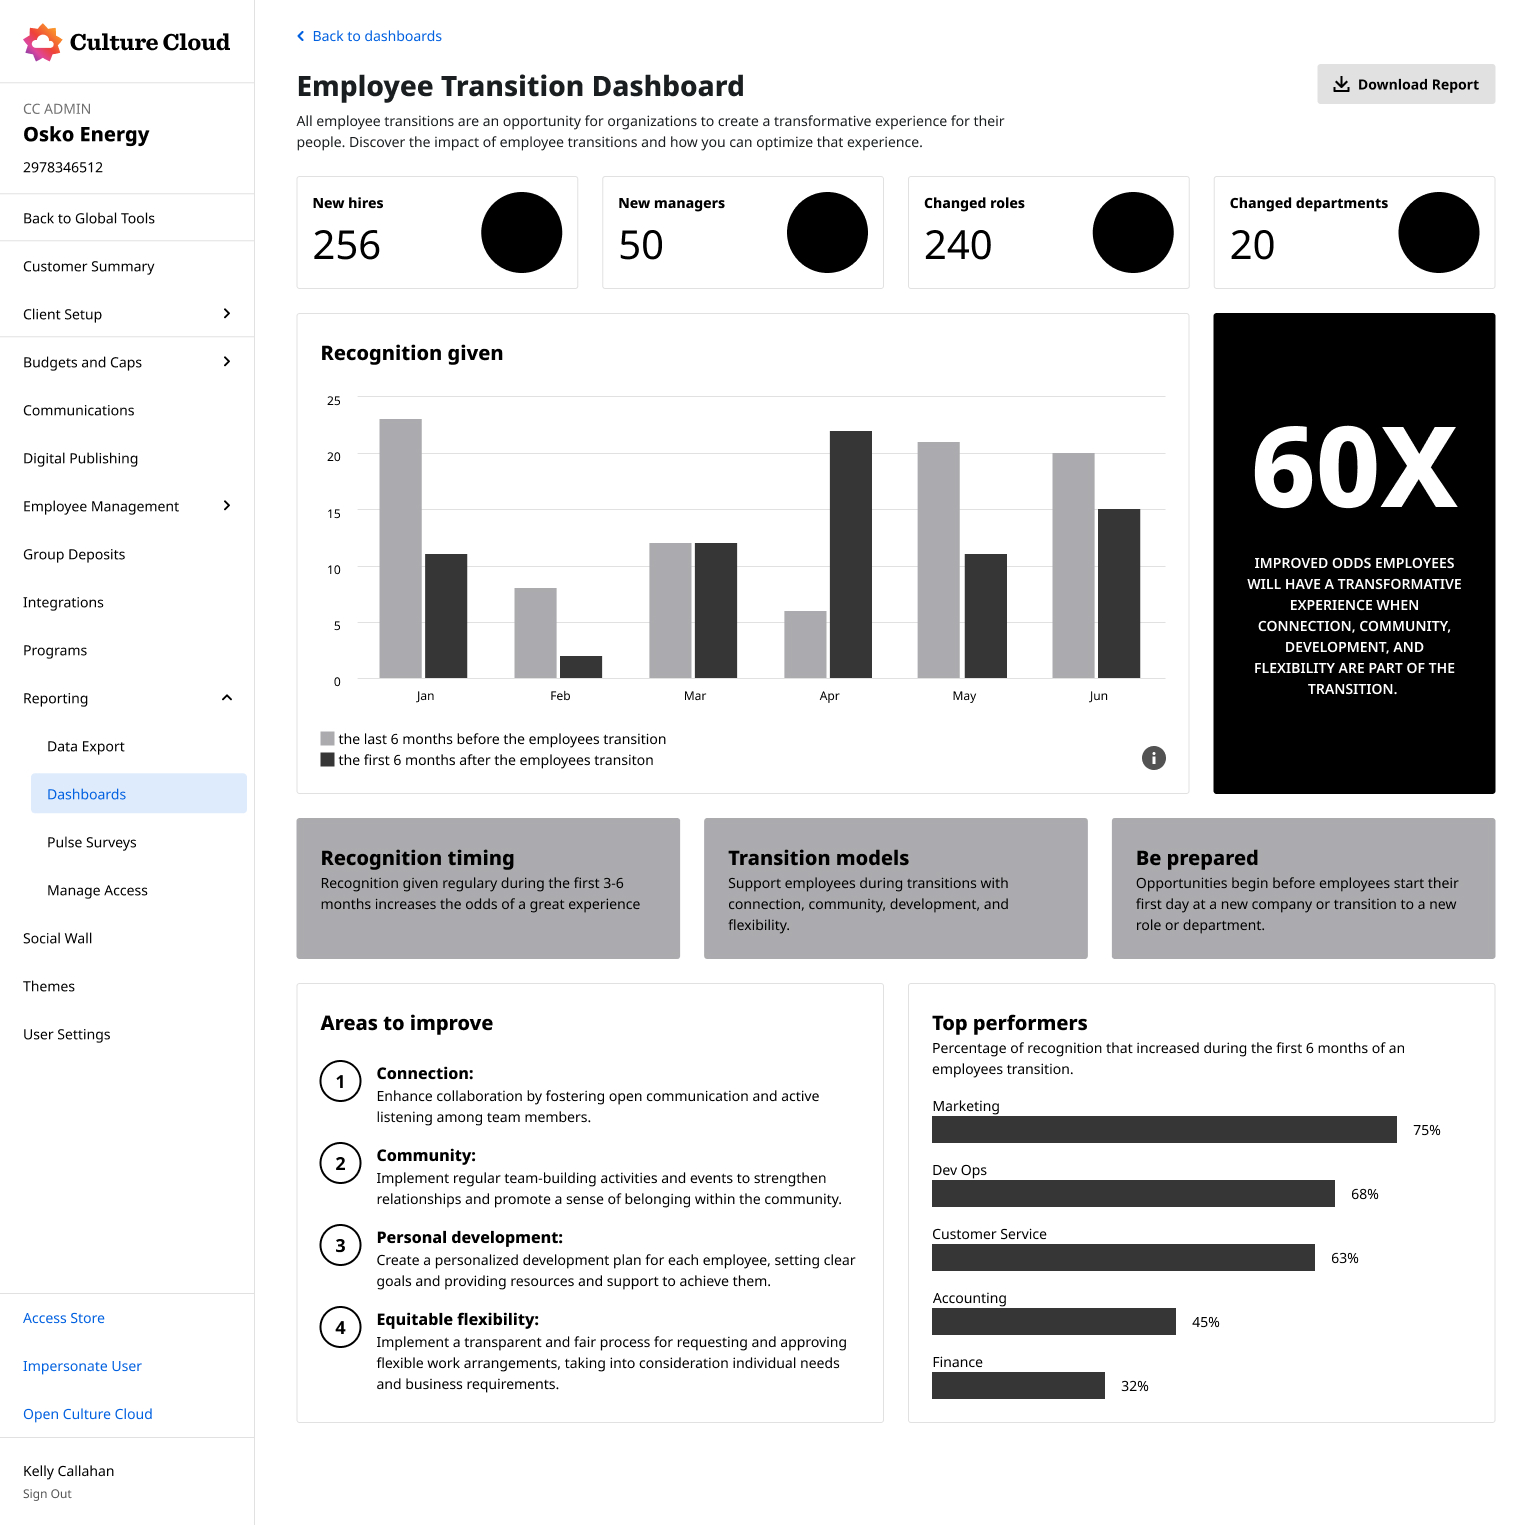
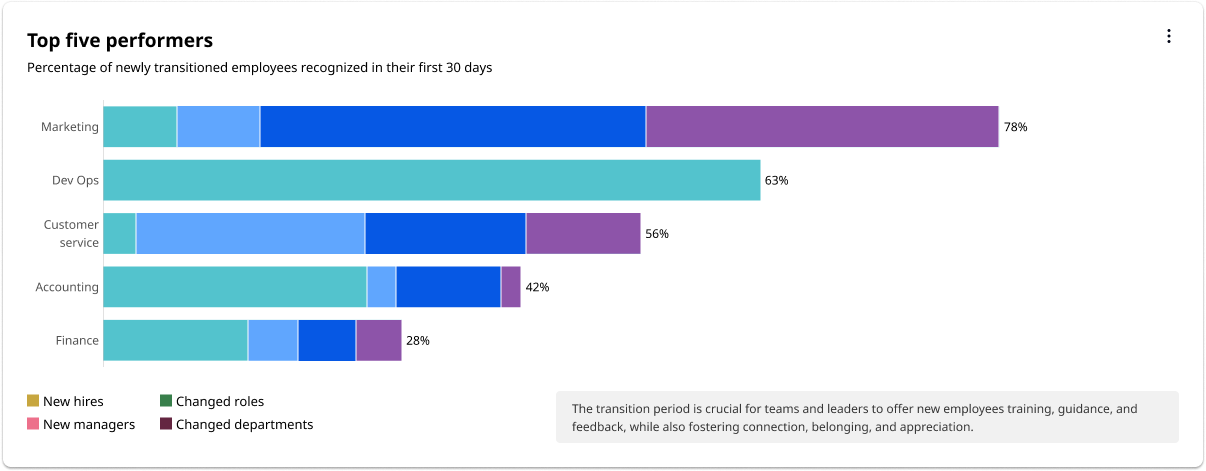
Some problems don't need more data, they need a clearer window into the data you already have. This project centered on building a corporate dashboard that gave client companies a real-time view of how quickly employees were recognized for making moves in their careers: where it's happening, how seen it's called out, and where to support those transitions.
The data behind the report was coming from fresh market research highlighting the importance of recognizing career transitions. The major hurdle was that the research was slated to be presented 6 weeks later at the annual client conference. We spun up a team to look at what data we had and how quickly we could pull together a product offering to support the marketing team during the biggest event of their year.
Ideation occured quickly. I pulled in a designer, data engineering team, and marketing research to define what data was available to us and how best we could communicate the research team's findings without jeopardizing delivery.
The workable designs for this project were iterated on and finalized in lighting rounds over 4 days. Moving quickly helped keep timelines realistic.
The biggest constraints were designing with available data (instead of data we wished we had), staying true to the findings of the research team, using Tableau design features out of the box. These constraints kept tight timelines attainable without boggin us down in what we "wished" we could build.
The final report was launched in time for O.C.Tanners annual client conference. It was even highlighted from the main stage during a keynote presentation.
In total, the team moved from idea inception to final delivery within 5 weeks.